Cloud Run 上の Apache で構造化ログ (JSON) と Trace ID 連携を実現する
Cloud Run 上の Apache で構造化ログ (JSON) と Trace ID 連携を実現する
English follows Japanese.
概要
- Cloud Run や GKE で Apache を動かす際、ログを JSON 形式(構造化ログ)で出力したい
- Cloud Logging 上でリクエストを一元管理するため、Trace ID や Span ID をログに含めたい
- アプリケーション(PHPなど)だけでなく、Web サーバーのログも同様に扱いたい
- 追加のモジュールやサイドカーを使わず、Apache の設定ファイルだけで実現する
はじめに
Cloud Run などのコンテナ環境で Web アプリケーションを運用する場合、ログの可観測性は非常に重要です。以前の記事 では Ruby on Rails アプリケーションのログを構造化し、Trace ID を連携させる方法を紹介しました。
今回は、WordPress や PHP アプリケーションの前段として動作することが多い Apache HTTP Server に焦点を当てます。Apache のアクセスログやエラーログも JSON 形式で出力し、かつ Google Cloud の Trace ID を埋め込むことで、Cloud Logging 上でのログ調査を劇的に快適にする方法を紹介します。
Nginx を使っている場合も同様のアプローチが可能です。log_format json escape=json 等を使うことができ、Apache よりも設定がシンプルです。本記事では Apache に特化して説明します。
また、Cloud Run ではなく、Google Cloud Load Balancing (GCLB) の背後で Apache を(例えば GKE 上で)動かしている場合にも同様のアプローチが可能です。今回は Cloud Run を前提に説明します。
私が提唱した Zero Scale WordPress という、DB をゼロスケールさせる WordPress のアーキテクチャでも同様の設定を使っています。参考までに、以下のリポジトリにある設定ファイル例もご覧ください。
https://github.com/takotakot/zeroscale-wp/blob/main/misc/other-vhosts-access-log.conf 及び https://github.com/takotakot/zeroscale-wp/blob/main/Dockerfile
背景と課題
デフォルトの Apache のログ形式 (Combined Log Format) はプレーンテキストであり、Cloud Logging に送られた場合、textPayload として扱われます。これには2つの不便な点があります。
- クエリの難しさ: ステータスコードやレスポンスタイムでフィルタリングする際、正規表現などを使う必要があり面倒
- トレースの分断: Cloud Run はリクエスト毎に Trace ID を付与しますが、Apache の標準ログにはこれが含まれません。そのため、特定のリクエストに関連するログ(Apache のアクセスログ + アプリケーションログ)をまとめて表示することが難しい
これらを解決するために、Apache の設定ファイルを工夫して、Google Cloud Logging に適した JSON ログを出力するようにします。
実装のアプローチ
実装のポイントは以下の2点です。
- Trace ID と Span ID の抽出: リクエストヘッダー(
traceparentまたはX-Cloud-Trace-Context)から Trace ID と Span ID を抽出し、環境変数に設定 - JSON ログフォーマットの定義:
LogFormatディレクティブを使用して、手動で JSON 文字列を構築
設定ファイルの実装
ベースとなる設定ファイル(例えば other-vhosts-access-log.conf やサイト設定ファイルなど)に以下の設定を追加します。
この設定では、mod_setenvif モジュールを使用して Trace ID と Span ID を抽出し、環境変数 google_trace_id に格納しています。PROJECT_ID も、直接指定するよりも、環境変数として渡す方が良いでしょう。コンテナイメージを環境毎に分ける必要がなくなります。アクセスログはリクエストの記録であるため、Severity は INFO としています。
# JSON log format configuration
# Allow breaking when User-Agent or Referer contains newline or double quotes.

# Cloud Run 上で PROJECT_ID 環境変数が必要です
PassEnv PROJECT_ID

# Trace ID の抽出
# レガシーな X-Cloud-Trace-Context からの抽出(念のため)
SetEnvIf X-Cloud-Trace-Context "^([0-9a-f]{32})/([0-9a-f]+).*$" google_trace_id=$1 google_span_id=$2
# W3C Trace Context (traceparent) からの抽出(こちらが優先)
SetEnvIf traceparent "^00-([a-f0-9]{32})-([a-f0-9]{16})-.+$" google_trace_id=$1 google_span_id=$2

# 他の便利変数の設定
SetEnvIf Remote_Addr "^(.*)$" real_client_ip=$1
SetEnvIf X-Forwarded-For "^([^,]+)" real_client_ip=$1
SetEnvIf Request_URI "^(.*)$" REQUEST_URI=$1

# AccessLog JSON format
# Cloud Logging が解釈できるフィールド名 (httpRequest など) を使用します
# microsecond 精度のタイムスタンプを含めています
LogFormat "{\
  \"time\":\"%{%Y-%m-%dT%H:%M:%S}t.%{usec_frac}tZ\"\
  , \"severity\":\"INFO\"\
  , \"forwardedFor\":\"%{X-Forwarded-For}i\"\
  , \"peerIp\":\"%h\"\
  , \"httpRequest\":{\
    \"requestMethod\":\"%m\"\
    , \"requestUrl\":\"https://%{Host}i%{REQUEST_URI}e\"\
    , \"requestSize\":%I\
    , \"status\":\"%>s\"\
    , \"userAgent\":\"%{User-Agent}i\"\
    , \"remoteIp\":\"%{real_client_ip}e\"\
    , \"serverIp\":\"%A\"\
    , \"referer\":\"%{Referer}i\"\
    , \"responseSize\":%B\
    , \"protocol\":\"%H\"\
  }\
  , \"totalBytesSent\":%O\
  , \"keepAliveCount\":%k\
  , \"internalResource\":\"%U\"\
  , \"serverLatencyMicros\":%D\
  , \"logging.googleapis.com/trace\":\"projects/%{PROJECT_ID}e/traces/%{google_trace_id}e\"\
  , \"logging.googleapis.com/spanId\":\"%{google_span_id}e\"\
}" json_combined

# 定義した json_combined フォーマットを適用
CustomLog ${APACHE_LOG_DIR}/access.log json_combined
重要なポイント: logging.googleapis.com/trace
Cloud Logging でログをグルーピングするためのキモとなるのが logging.googleapis.com/trace フィールドです。このフィールドの値は projects/[PROJECT_ID]/traces/[TRACE_ID] という形式である必要があります Logging エージェント: 特別な JSON フィールド。
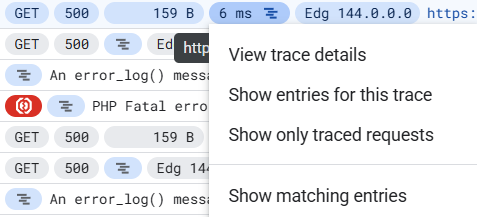
Apache の設定内で %{PROJECT_ID}e と %{google_trace_id}e を使って動的にこの文字列を埋め込んで出力しています。これにより、Cloud Logging の画面で「このトレースのエントリを表示 (Show entries for this trace)」機能が使えるようになります。
ErrorLog の構造化
エラーログについても同様に ErrorLogFormat を使って JSON 化することが可能です。ErrorLog では、未定義変数がある場合に、「その固まりごと」省略されるという仕様があります。例えば、起動時のログには Trace ID は含まれません。その場合に、注意しないと JSON が壊れてしまいます。
以下の設定例では、% , という形式でカンマごと省略されるようにしています。「カンマの後にスペースを入れない」のがポイントです。JSON の構造が壊れないように工夫しています。詳しくは ErrorLogFormat ドキュメント を参照してください。先カンマ形式を使うことで、Trace ID がない場合でも有効な JSON が出力されます。
実は、ErrorLog の方は、microsecond 精度のタイムスタンプを出力できないため、time フィールドは省略しています。Cloud Run の基盤側でログを受け取った際に自動でタイムスタンプが付与されるため、問題ありません。
# ErrorLog JSON format.
# "% " を使うことで、変数が未定義の場合にカンマごと省略される仕様です。
# 参照: https://httpd.apache.org/docs/2.4/en/mod/core.html#errorlogformat
ErrorLogFormat "{\
\"severity\":\"%l\"\
% ,\"module\":\"%m\"\
% ,\"pid\":\"%P\"\
% ,\"tid\":\"%T\"\
% ,\"remoteIp\":\"%a\"\
% ,\"message\":\"%M\"\
% ,\"fileLocation\":\"%F\"\
% ,\"errorCode\":\"%E\"\
% ,\"logging.googleapis.com/trace\":\"projects/%{PROJECT_ID}e/traces/%{google_trace_id}e\"\
% ,\"logging.googleapis.com/spanId\":\"%{google_span_id}e\"\
% \
}"
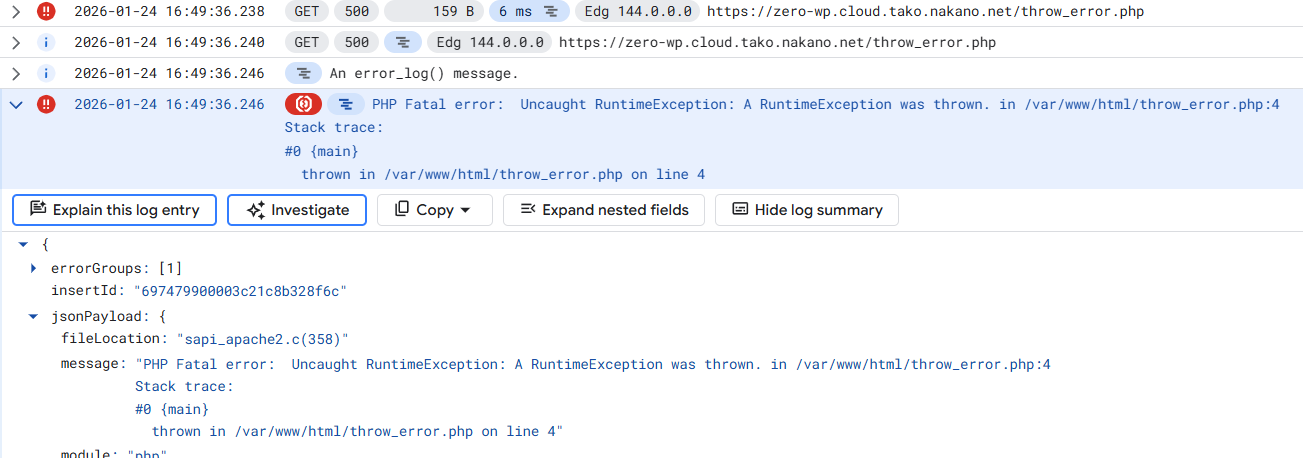
ErrorLog ${APACHE_LOG_DIR}/error.logエラーが発生した際も Trace ID が記録されるため、特定のリクエストで何が起きたかを追跡しやすくなります。
Dockerfile での適用例
WordPress の公式イメージなどを使用している場合、既存の設定ファイルを上書きしたり、デフォルトの設定を書き換えたりする必要があります。以下は wordpress:php8.4-apache をベースにした Dockerfile の例です。
FROM wordpress:php8.4-apache

# 上記の設定内容を保存した misc/other-vhosts-access-log.conf をコンテナ内の設定パスにコピー
# 既存の other-vhosts-access-log.conf は削除してからコピー(念のため)
# デフォルトのサイト設定 (000-default.conf) で使われている 'combined' フォーマットを 'json_combined' に置換
RUN rm -f /etc/apache2/conf-enabled/other-vhosts-access-log.conf && \
    sed -i 's/combined/json_combined/g' /etc/apache2/sites-available/000-default.conf

COPY misc/other-vhosts-access-log.conf /etc/apache2/conf-enabled/other-vhosts-access-log.conf

# アプリケーションコードのデプロイ等
# COPY --chown=www-data:www-data root_dir/ /var/www/html/この例では、other-vhosts-access-log.conf を独自の設定ファイル(前述の LogFormat 定義などが書かれたもの)で上書きすることで、設定を読み込ませています。また、sed コマンドでデフォルトの VirtualHost 設定が新しい json_combined を使うように変更しています。
実際のログ確認
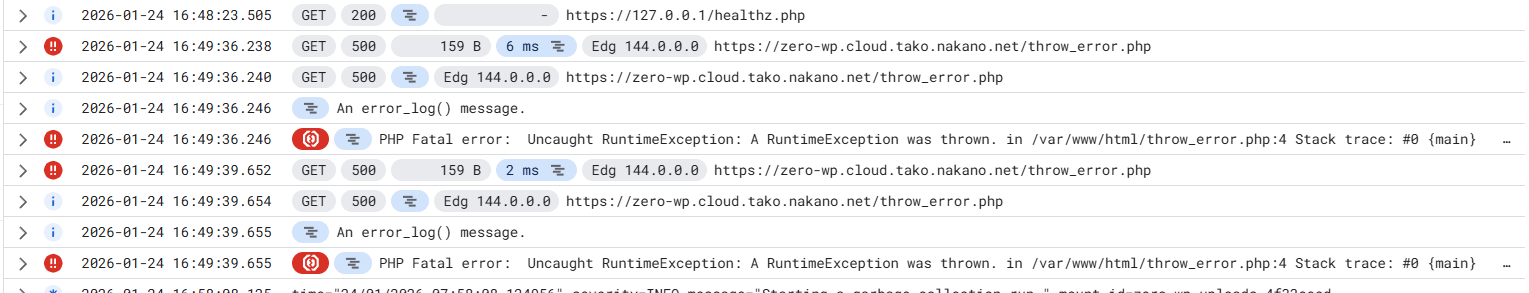
実際に /throw_err.php という意図的にエラーを発生させるスクリプトを作成し、アクセスして確認してみます。2回アクセスを行いました。
ひとつ目の Cloud Run のロードバランサのログの≡のようなアイコンをクリックし、「このトレースのエントリを表示 (Show entries for this trace)」を選択します。
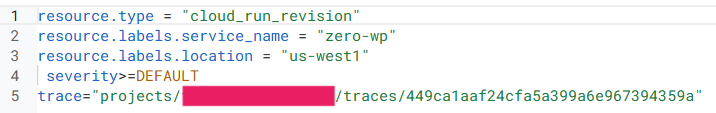
trace="projects/[PROJECT_ID]/traces/449ca1aaf24cfa5a399a6e967394359a" というフィルタが加わります。
上図は、フィルタ適用後のログ一覧です。フィルタによって、関係するログだけが抽出され、時系列に並んで表示されています。Cloud Logging の Trace ID でフィルタすることで、以下の一連の4つのログが一つの画面に集約されて表示されます。
- Cloud Load Balancing: 最初のリクエストの受け付け
- Apache Access Log: コンテナの前段でのアクセス記録
- Application Error Log: PHP アプリケーション内でのログ出力(
error_log関数など) - Application Error Log: PHP アプリケーション内でのエラー発生(
throwして終了した)
「どのリクエストが原因でエラーが発生したのか?」を簡単に特定できるようになるため、障害対応やパフォーマンスチューニングが非常に楽になります。また、リクエストがどこを通って、最終的にどのようなエラーになったのかが一目瞭然となり、デバッグ効率が大幅に向上します。
注意点
環境変数 PROJECT_ID:
Cloud Run の環境変数として PROJECT_ID を渡す必要があります。Terraform や gcloud run deploy の引数で設定してください。メタデータサーバーから取得する方法もありますが、Apache の起動前に環境変数にセットされている方が設定ファイルでの扱いが簡単です。
エスケープ処理:LogFormat 内で " (ダブルクォート)をバックスラッシュでエスケープする必要があります。手動で JSON を組み立てているため、User-Agent などに改行や不正な文字列が含まれると JSON が壊れる可能性がありますが、Apache のログ出力はデフォルトで制御文字をエスケープしてくれるため、多くの場合問題になりません。Format Notes を参照してください。
まとめ
Apache の設定を少し工夫するだけで、モダンなクラウドネイティブ環境に適した構造化ログを出力することができます。
SetEnvIfでtraceparentから Trace ID と Span ID を抽出LogFormatで JSON を構築し、logging.googleapis.com/traceを含める
これにより、Cloud Logging 上で「ステータスコード 500 のリクエスト」をフィルタリングし、そのリクエストに関連する「Apache のアクセスログ」と「アプリケーションのエラーログ」を Trace ID で紐付けて一気通貫で確認できるようになります。
可観測性が向上すると、障害対応やパフォーマンスチューニングの効率が格段に上がります。ぜひ試してみてください。
Implementing Structured Logging (JSON) and Trace ID Integration for Apache on Cloud Run
Overview
- Output logs in JSON format (structured logging) when running Apache on Cloud Run or GKE.
- Include Trace IDs and Span IDs in logs to centralize and group requests in Cloud Logging.
- Handle Web server logs in the same way as application (e.g., PHP) logs.
- Achieve this using only Apache configuration files, without additional modules or sidecars.
Introduction
When operating web applications in container environments like Cloud Run, log observability is crucial. In a previous article, we introduced a request to structure logs for Ruby on Rails applications and integrate Trace IDs.
This time, we focus on Apache HTTP Server, which often operates as a frontend for WordPress or PHP applications. We will introduce a method to make log investigation on Cloud Logging dramatically more comfortable by outputting Apache access logs and error logs in JSON format and embedding Google Cloud Trace IDs and Span IDs.
A similar approach is possible if you are using Nginx. You can use directives like log_format json escape=json, which makes configuration simpler than Apache. This article focuses specifically on Apache.
Also, a similar approach is possible if you are running Apache behind Google Cloud Load Balancing (GCLB) (for example, on GKE) instead of Cloud Run. This article assumes Cloud Run.
We also use similar settings in the Zero Scale WordPress architecture I proposed, which zero-scales the database for WordPress. For reference, please see the example configuration files in the following repository:
https://github.com/takotakot/zeroscale-wp/blob/main/misc/other-vhosts-access-log.conf and https://github.com/takotakot/zeroscale-wp/blob/main/Dockerfile
Background and Challenges
The default Apache log format (Combined Log Format) is plain text, which is treated as textPayload when sent to Cloud Logging. This presents two inconveniences:
- Difficulty in Querying: Filtering by status code or response time requires using regular expressions, which is cumbersome.
- Fragmentation of Traces: Cloud Run assigns a Trace ID to each request, but this is not included in Apache’s standard logs. This makes it difficult to display logs related to a specific request (Apache access logs + application logs) together.
To solve these issues, we will tweak the Apache configuration files to output JSON logs suitable for Google Cloud Logging.
Implementation Approach
There are two key points to the implementation:
- Extract Trace ID and Span ID: Extract the Trace ID and Span ID from the request header (
traceparentorX-Cloud-Trace-Context) and set them to environment variables. - Define JSON Log Format: Use the
LogFormatdirective to manually construct a JSON string.
Configuration File Implementation
Add the following settings to your base configuration file (e.g., other-vhosts-access-log.conf or a site configuration file).
In this configuration, we use the mod_setenvif module to extract the Trace ID / Span ID and store it in the google_trace_id/google_span_id environment variable. It is better to pass PROJECT_ID as an environment variable rather than specifying it directly. This eliminates the need to separate container images for each environment. Since access logs record requests, the Severity is set to INFO.
# JSON log format configuration
# Allow breaking when User-Agent or Referer contains newline or double quotes.

# PROJECT_ID environment variable is required on Cloud Run
PassEnv PROJECT_ID

# Trace ID Extraction
# Extraction from legacy X-Cloud-Trace-Context (just in case)
SetEnvIf X-Cloud-Trace-Context "^([0-9a-f]{32})/([0-9a-f]+).*$" google_trace_id=$1 google_span_id=$2
# Extraction from W3C Trace Context (traceparent) (This is preferred)
SetEnvIf traceparent "^00-([a-f0-9]{32})-([a-f0-9]{16})-.+$" google_trace_id=$1 google_span_id=$2

# Setting other convenient variables
SetEnvIf Remote_Addr "^(.*)$" real_client_ip=$1
SetEnvIf X-Forwarded-For "^([^,]+)" real_client_ip=$1
SetEnvIf Request_URI "^(.*)$" REQUEST_URI=$1

# AccessLog JSON format
# Use field names that Cloud Logging can interpret (like httpRequest)
# Include timestamp with microsecond precision
LogFormat "{\
  \"time\":\"%{%Y-%m-%dT%H:%M:%S}t.%{usec_frac}tZ\"\
  , \"severity\":\"INFO\"\
  , \"forwardedFor\":\"%{X-Forwarded-For}i\"\
  , \"peerIp\":\"%h\"\
  , \"httpRequest\":{\
    \"requestMethod\":\"%m\"\
    , \"requestUrl\":\"https://%{Host}i%{REQUEST_URI}e\"\
    , \"requestSize\":%I\
    , \"status\":\"%>s\"\
    , \"userAgent\":\"%{User-Agent}i\"\
    , \"remoteIp\":\"%{real_client_ip}e\"\
    , \"serverIp\":\"%A\"\
    , \"referer\":\"%{Referer}i\"\
    , \"responseSize\":%B\
    , \"protocol\":\"%H\"\
  }\
  , \"totalBytesSent\":%O\
  , \"keepAliveCount\":%k\
  , \"internalResource\":\"%U\"\
  , \"serverLatencyMicros\":%D\
  , \"logging.googleapis.com/trace\":\"projects/%{PROJECT_ID}e/traces/%{google_trace_id}e\"\
  , \"logging.googleapis.com/spanId\":\"%{google_span_id}e\"\
}" json_combined

# Apply the defined json_combined format
CustomLog ${APACHE_LOG_DIR}/access.log json_combined
Important Point: logging.googleapis.com/trace
The key to grouping logs in Cloud Logging is the logging.googleapis.com/trace field. The value of this field must be in the format projects/[PROJECT_ID]/traces/[TRACE_ID]Logging agent: Special JSON fields.
In the Apache configuration, we dynamically embed this string using %{PROJECT_ID}e and %{google_trace_id}e for output. This enables the "Show entries for this trace" feature in the Cloud Logging interface.
Structuring ErrorLog
Similarly, ErrorLog can be converted to JSON using ErrorLogFormat. For ErrorLog, there is a specification where if a variable is undefined, the "chunk" containing it is omitted. For example, startup logs do not contain a Trace ID. In such cases, care must be taken not to break the JSON.
In the configuration example below, we use the format % , to omit the comma along with the variable. The point is "do not put a space after the comma". This is a trick to prevent the JSON structure from breaking. For details, refer to the ErrorLogFormat documentation. Using the leading comma format outputs valid JSON even when the Trace ID is missing.
Actually, the ErrorLog cannot output timestamps with microsecond precision, so the time field is omitted. Since the Cloud Run infrastructure automatically adds a timestamp when it receives the log, this is not an issue.
# ErrorLog JSON format.
# By using "% ", the specification allows omitting the entire chunk including the comma when the variable is undefined.
# Reference: https://httpd.apache.org/docs/2.4/en/mod/core.html#errorlogformat
ErrorLogFormat "{\
  \"severity\":\"%l\"\
  % ,\"module\":\"%m\"\
  % ,\"pid\":\"%P\"\
  % ,\"tid\":\"%T\"\
  % ,\"remoteIp\":\"%a\"\
  % ,\"message\":\"%M\"\
  % ,\"fileLocation\":\"%F\"\
  % ,\"errorCode\":\"%E\"\
  % ,\"logging.googleapis.com/trace\":\"projects/%{PROJECT_ID}e/traces/%{google_trace_id}e\"\
  % ,\"logging.googleapis.com/spanId\":\"%{google_span_id}e\"\
  % \
}"
ErrorLog ${APACHE_LOG_DIR}/error.log
Trace IDs are recorded even when errors occur, making it easier to track what happened with a specific request.
Dockerfile Application Example
If you are using an official image like WordPress, you may need to overwrite existing configuration files or rewrite default settings. Below is an example of a Dockerfile based on wordpress:php8.4-apache.
FROM wordpress:php8.4-apache

# Copy misc/other-vhosts-access-log.conf containing the above settings to the configuration path in the container
# Delete the existing other-vhosts-access-log.conf before copying (just in case)
# Replace the 'combined' format used in the default site configuration (000-default.conf) with 'json_combined'
RUN rm -f /etc/apache2/conf-enabled/other-vhosts-access-log.conf && \
    sed -i 's/combined/json_combined/g' /etc/apache2/sites-available/000-default.conf

COPY misc/other-vhosts-access-log.conf /etc/apache2/conf-enabled/other-vhosts-access-log.conf

# Deploy application code, etc.
# COPY --chown=www-data:www-data root_dir/ /var/www/html/
In this example, we overwrite other-vhosts-access-log.conf with our own configuration file (containing the aforementioned LogFormat definition, etc.) to load the settings. Also, we use the sed command to change the default VirtualHost configuration to use the new json_combined.
Actual Log Verification
Let’s verify this by creating a script called /throw_err.php that intentionally generates an error and accessing it. I accessed it twice.
Click on the icon that looks like ≡ in the first Cloud Run load balancer log and select "Show entries for this trace".
A filter like trace="projects/[PROJECT_ID]/traces/449ca1aaf24cfa5a399a6e967394359a" is added.
The figure above shows the list of logs after applying the filter. As you can see, by filtering with the Cloud Logging Trace ID, the following series of four logs are aggregated and displayed on a single screen.
- Cloud Load Balancing: Receipt of the initial request
- Apache Access Log: Access record at the container frontend
- Application Error Log: Log output within the PHP application (e.g.,
error_logfunction) - Application Error Log: Error occurrence within the PHP application (terminated by
throw)
This makes it very easy to identify "which request caused the error", greatly easing troubleshooting and performance tuning. Also, the path of the request and the final error become obvious at a glance, significantly improving debugging efficiency.
Important Notes
PROJECT_ID Environment Variable:
You need to pass PROJECT_ID as a Cloud Run environment variable. Set it via Terraform or the arguments for gcloud run deploy. While it’s possible to retrieve it from the metadata server, it is easier to handle in the configuration file if it is set in an environment variable before Apache starts.
Escaping:
You need to escape " (double quotes) with a backslash inside LogFormat. Since we are manually assembling JSON, the JSON might break if User-Agent or other fields contain newlines or invalid strings. However, Apache’s log output escapes control characters by default, so this is rarely a problem. Please refer to Format Notes.
Summary
With just a few tweaks to your Apache configuration, you can output structured logs suitable for modern cloud-native environments.
- Extract Trace ID and Span ID from
traceparentusingSetEnvIf. - Construct JSON using
LogFormatand includelogging.googleapis.com/trace.
This allows you to filter "requests with status code 500" on Cloud Logging and check the related "Apache access logs" and "Application error logs" linked by Trace ID in one go.
Improved observability significantly increases the efficiency of troubleshooting and performance tuning. Please give it a try.